Thursday, January 27, 2011

Test Characteristic Curve

Next     Back    Start                        Chapter 13

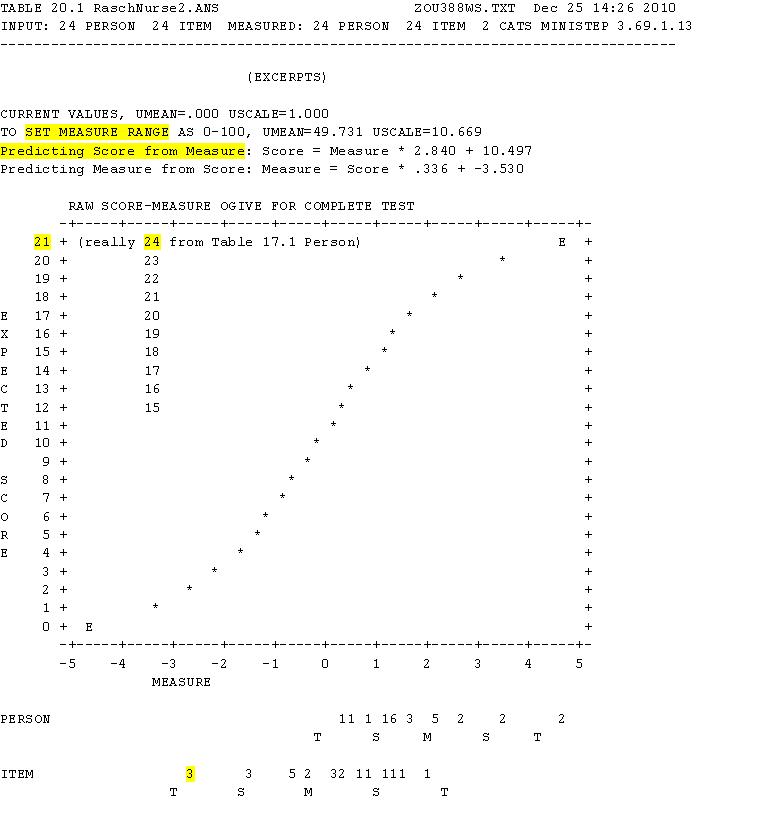
The test characteristic curve (TCC) is used to relate one test with another. Ministep Table 20.1, Raw Score-Measure Ogive for Complete Test, displays the TCC and the expected raw scores when student ability measures equal item difficulty measures.

The TCC results from Winsteps processing observed student test scores into estimated measures and then predicting expected student raw scores. 

Table 20.1 assists in predicting raw scores from estimated measures and the reverse (mapping). This relationship is fully linear rather than an ogive. Values are also presented to assist in setting the range of scaled scores, of replacing the unit for measures (the logit) with arbitrary values.

Winsteps has a problem with questions and students who generate perfect scores. The TCC in Table 20.1 terminates with 21 rather than 24 as all students marked three items correctly. Perfect scores are rare when using several hundred answer sheets. Other factors influence the TCC and it use.

Winsteps uses “fit” to describe how well persons and items match the Rasch model requirements. PUP uses “fitness” to describe how well the test matches student preparation. The fitness value is also called the average student educated guessing score. It has a value of 100% on a perfect test (a check list of what students have mastered). Fitness has a value of 25% on a 4-option multiple-choice test where all options are about equally marked. This would be a very difficult test, requiring considerable guessing when forced-choice scoring.

The average student educated guessing score ranged between 38.7% and 55.8%, on PUP Table 5, with an average of 47.8%. About half of the answer options on the test could be discarded by students functioning at higher levels of thinking before selecting their “best” right answers.

Guessing is not a part of the Rasch model. With test fitness near 50%, and an average test score of 84%, guessing had little effect on the scores of this test. Guessing can have a marked effect on test scores when test fitness drops to the design level of 25% for 4-option questions. At this point the Rasch model and the three-parameter (3-P) IRT model, that includes guessing, diverge widely.

Forced-choice or guess testing requires a mark on each question. Knowledge and Judgment Scoring (KJS) only requires a mark to use a question as a means of reporting what a student actually knows or can do (what is known and the judgment to correctly use what is known). The Rasch model labors under the requirement for students to guess just as with traditional, right mark, scoring. The partial credit Rasch model may serve KJS better.

Next    Back    Start

Friday, January 21, 2011

Person Item Map

Next   Back   Start                        Chapter 12

Ministep Table 1.0 combines the data in Table 13.1 Person, and Table 17.1, Item, into a second visual display of test results (also see bubble graphic). Estimated student ability and item difficulty measures are placed side by side, in one vertical dimension, and in the same sequence as the normal distributions are on PUP Table 3 in two dimensions.
The normally distributed test scores (right marks) and difficulties (wrong marks) have been edited into Table 1.0 to again show the difference between the two distributions (normal and logit). The logit scale suggests that it takes more effort to move from a score of 22 to 23 than from 15 to 16.

Winsteps Table 1.0 shows which students and questions match on an estimated student-ability:question-difficulty measure scale. The most efficient testing is done with items and students that have similar estimated measures.

The Rasch Model is therefore a common method for calibrating test items for use in computerized adaptive testing (CAT). After each examinee’s forced response to a question, the computer quickly calculates the expected range of success for this student and delivers a more difficult one if the response was right and an easier one if the response was wrong. The test ends when the score falls within, or without, preset confidence limits or the maximum number of questions or time is reached.

Healy, Nicho, and Summi, estimated person measure of 1.73, can be expected to earn a score of 85% on items with an estimated difficulty measure of zero (=exp(Ability-Difficulty)/(1+(exp(Ability-Difficulty)) or exp(1.73 - 0)/(1+exp(1.73 - 0)) or exp(1.73)/(1+exp1.73) or 5.65/(1+5.64) or 5.64/6.64 or 0.85 or 85%). This makes sense, as the average test score and item difficulty were 84%.

Insert your choice of ability and difficulty into the Rasch model to predict expected raw scores on future tests. Salto (or a group of students with Salto’s ability), estimated person measure of 0.34, can expect to answer 20% of items correctly that have an estimated difficulty measure of 1.73 (=exp(0.34 – 1.73)/(1+(exp(0.34 – 1.73)). Salto also has a 20% or 0.2 chance of answering correctly any one question with a difficulty measure of 1.73. CAT would use some easy questions to assess Salto. They could be like the questions on this test.

Next     Back      Start

Thursday, January 13, 2011

Rasch Estimated Measures

Next    Back    Start                        Chapter 11

Deep within the Rasch model is the mystery of how person and item normal scales are combined into one logit scale. Ministep starts with a typical data matrix, such as PUP Table 3.

Question difficulty is converted from the number of right marks to the number of wrong marks in Step 1.  The average difficulty of 84% right is now expressed as 16% wrong.


The cells recording right and wrong marks in PUP Table 3 are converted to probabilities. The marginal cells, in Table 3, for student score and question difficulty are converted from normal to logit values in Step 2.

The initial location of student scores and question difficulty ranges from  nearly -5 logits to nearly +5 logits for the student nurse test results on PUP Table 3. 

In Step 3, the final location for estimated student ability and item difficulty measures results when the item difficulty measure of zero (0) logits rests below the normal average student score (84% right). The normal average test item difficulty (16% wrong) rests below the student ability measure of zero (0) logits.


     --------0--------------84%------- person ability 
----------16%-------------0-----       item difficulty 

Equivalent means are in registration. They mark off equivalent lengths (1.66 measures) of the logit scale on this test.

This is not just a case of shifting the item tally past the ability tally, but a re-plotting of the item values onto a single logit scale. Re-plotting compressed the negative item measure locations by 0.84 and expanded the positive item measure locations by 1.16 to create a close fit to the Winsteps Person-Item Bar Chart.

There are many ways to set person and item final locations, the basis for the test characteristic curve (TCC). Winsteps uses two methods in series, normal approximation algorithm (PROX) and joint maximum likelihood estimation (JMLE). For this test it cycled through PROX twice and then through JMLE twice.

Next    Back    Start


Wednesday, January 5, 2011

Item Characteristic Curve

Next     Back    Start                                     Chapter 10

An item characteristic curve (ICC) displays the probability of a right mark, or the portion of each group of students, with the same ability, to make a right mark. The raw scores, ranging from 15 to 24, are from the Total Score column in Winsteps Table 17.1, Person Statistics.

A student with a raw score of 15 missed Item 8 for an observed average score of zero on Winsteps Table 29.8. Individual students with raw scores of 16, 17, and 18 marked correctly had observed average scores of 1.0. A group of 6 students had average raw score of 19, 4 right:2 wrong or 4/6 or 0.67 observed average score. The ten groups plotted on Table 29.8 are circled on PUP Table 3.  
The Ministep graph, Expected Score and Empirical ICC, 8.8, displays the same information as in Table 29.8. The Model ICC, in Table 29.8, changes from a series of dots to a flowing line in the ICC graph.

The ten student ability groups found for Item 8 also hold for all the other items. An ICC defines item difficulty using student test scores. The standard reference point of zero logit and 0.5 probability or 50% expected test score is also marked on this graph.

On this test, the students were more able than the questions were difficult. This was either an easy test or the students were well prepared. Item 8 was a central performer (difficulty of 83%) on a test with an average score of 84%. The person and item locations for estimated measures on the horizontal axis correspond to their series of ogives on a 1-parameter IRT model.

A test characteristic curve (TCC) is developed by combining all of the ICCs. Persons with high ability fall to the right and those with low ability fall to the left (negative). Difficult items fall to the right and easy items fall to the left (negative). The consequence is that all along this line, student ability equals item difficulty (the ratio that Dr. Rasch discovered). The two highest ability students answered all questions correctly. The three easiest questions were answered correctly by all students.

Next      Back       Start