32
(Single-cycle
Rasch model measures estimation)
How
student scores and item difficulty can be re-plotted onto one scale was considered
graphically in Rasch estimated measures. The item difficulty mean
was placed in register with the student ability zero location on the logit
scale. The item difficulty zero location was then in register with the student
ability mean location. Equivalent portions of the scale for the two
distributions (item to student: mean to zero and zero to mean) were in register
with one another.
This
same thing can be done by capturing the required properties in numbers. These
estimates can be made with PROX for a data set with no missing marks. (This is
no problem using traditional right count scoring when omits are scored as
wrong.) Catherine E. Cantrell published in 1997 the step-by-step calculations
for PROX.
These
estimates are summarized in PUP Table 10. The table lists
values for right and wrong counts, and ability and difficulty measures. The
table provides an insight into how PROX performs. It is the source for several
charts.
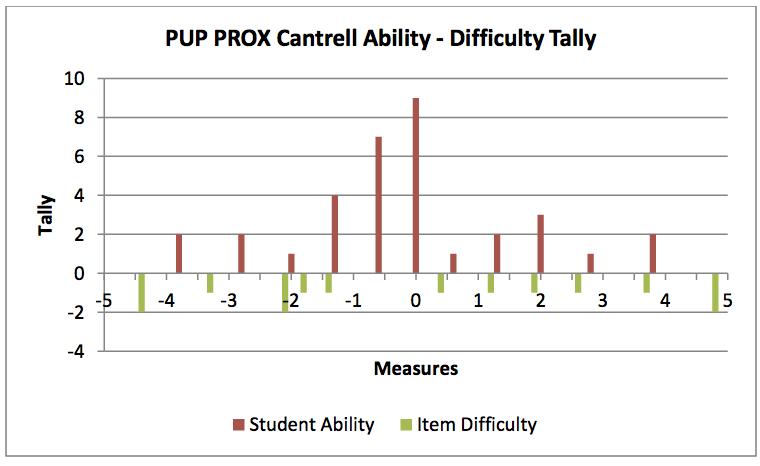
[Plotting
the tally column by the expanded measures columns yields the student ability–item
difficulty (Winsteps bar) tally. Plotting the black box output column (Winsteps expected student scores) by the expanded measures
columns yields the test characteristic curve (TCC). And plotting the output
columns by the input columns yields the black box audit tool that is responsive
to all changes made.]
PROX
makes a tally of the student right mark counts and the item wrong mark counts
(columns one and seven). The observed scores are converted into natural log
ratios (right/wrong for score ratios and wrong/right for item ratios) to obtain
a nearly linear logit scale.
Now
to shift the item difficulty mean to the student ability zero location on the
logit scale. The logit scale starts at zero and radiates in either direction
(-5 to +5 in this example). The initial item measure mean was 0.22 logits. This
is subtracted from each item difficulty measure (column 9) to shift the item difficulty
measure distribution into register with the student ability measure distribution
(as was done graphically in Rasch estimated measures).
 The
final step is to apply an expansion factor. It is based on the variance within student score and
item difficulty measures. The expansion factor chart shows that as the standard deviation for item difficulty
grows, the greater is the resulting expansion factor. In general, the expansion
factor for ability is about twice that for difficulty. It is normal for item
difficulty to spread out in a wider distribution than student ability scores.
The
expansion factor for student ability is obtained for PROX by taking the square
root of the ratio of the
variance within item difficulty measures (U) to the product of the variances for student ability and item
difficulty measures. The expansion factor for item difficulty is based on the ratio of the variance within
student ability measures (V) to the
product of the same two variances.
After
adding in constants to match the logistic and normal distributions (1.7, 2.89 =
1.7 squared, and 8.35 = 2.89 squared) the expansion factors become
SQRT((1+(U/2.89))/(1-((U*V)/8.35))) for student ability and
SQRT((1+(V/2.89))/1-((U*V)/8.35))) for item difficulty measures. The expand (expanded)
table columns are the products of the student ability logit values or item difficulty
shift values and their respective expansion factors.
[Multiplying
pools the source variances U and V. Dividing their variances by the pool
assigns a portion to each source. The larger portion is applied to the smaller
source (which is normally the student score distribution). The expansion
factors increase the spread of the ability and difficulty measure distributions
each way (+ & -) from the zero measure location. The entire PROX process
for estimating measures includes simple math and no pixy dust.]
 The
student ability and item difficulty expanded values are plotted on the ability-difficulty
tally chart. The goal is, to have a student ability to mark a correct answer
50% of the time, match an item with a difficulty of equal magnitude. By
definition this happens at the zero logit (measure) location. Does this
continue to occur as one moves further away from the zero logit location?
The
student ability and item difficulty expanded values are plotted on the ability-difficulty
tally chart. The goal is, to have a student ability to mark a correct answer
50% of the time, match an item with a difficulty of equal magnitude. By
definition this happens at the zero logit (measure) location. Does this
continue to occur as one moves further away from the zero logit location?
Cantrell,
Catherine E. (1997). Item Response Theory: Understanding the One-Parameter
Rasch Model. 42 p. Paper presented at the Annual Meeting of the Southwest
Educational Research Association (Austin, TX, January 23, 1997). EDRS: ED 415
281.
 Data from the 24-student by 24-item Nursing1 test was selected to compare non-iterative PROX and Winsteps. PUP Table 10 shows 22 students and 21 items remaining after excluding extreme values. The average test score for these students, preparing for a standardized test, was 80%.
 The sequence of student ability and item difficulty plots, for PROX and Winsteps, in every case, appear in order at a resolution of 1/10 measure. Sixteen of the twenty points
are identical for the two methods of estimation. There is little question that corresponding student ability and item
difficulty values are being accurately plotted.
The sequence of student ability and item difficulty plots, for PROX and Winsteps, in every case, appear in order at a resolution of 1/10 measure. Sixteen of the twenty points
are identical for the two methods of estimation. There is little question that corresponding student ability and item
difficulty values are being accurately plotted.
 The black box charts show that the mean for item difficulty was
successfully moved to the 50% (zero logit) position by both methods for
estimating measures. This required a shift (-1.62 logit) and an expansion
factor (1.11 logit) for PROX. The average input value (20%) was changed to an average
output value of 50%, a change of 30% when converting the negative item count to
a positive student expected score.
The black box charts show that the mean for item difficulty was
successfully moved to the 50% (zero logit) position by both methods for
estimating measures. This required a shift (-1.62 logit) and an expansion
factor (1.11 logit) for PROX. The average input value (20%) was changed to an average
output value of 50%, a change of 30% when converting the negative item count to
a positive student expected score.