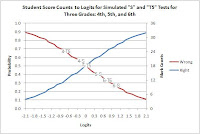
The Rasch model came into being in response to data that Dr. Georg Rasch graphed. He administered two tests to each student in several grades. The 6th graders made fewer wrong marks than the 5th and 4th graders on the same questions.
He plotted one test on the horizontal axis and the other on the vertical axis. He observed, “the three assemblies of points which illustrated the amount of errors in the different grades immediately succeeded each other and pointed towards the 0-point.”
 Further, he noted that one error on one test (“S”) corresponded to 1.2 errors on the other test (“T5”). This ratio remained the same for each of the three grades, 4th, 5th, and 6th. “An expression for the degree of difficulty of one test in relation to another has thus been found”.
For this constant ratio to happen, the chance to mark a right answer must be equally good whenever the ratio of student proficiency to question difficulty is the same. A student has a 50% chance of correctly marking items when student ability equals question difficulty. “The chances of solving an item thus come to depend only on the ratio between proficiency and degree of difficulty, and this turns out to be the crux of the matter.”
The average wrong score for each of the six tests is marked on the wrong answer ogive (curve). The 5th grade “T5” simulated (5-T5) test had an average score of 50%. This 50% score is located at the zero (0) point on the logit scale. (Remember, an ogive is a normal distribution expressed in logits.)
 Applying the Rasch model to the logit values, without further information, only returns the original right mark raw scores: A count of 27 out of 36 total questions is 27/36 or 75%, is odds of right/wrong or 75/25 or 3, and as logits is log(odds) or log(3) or 1.1. In reverse, percent is exp(logits)/(1+exp(logits)) or exp(1.1)/(1+exp(1.1)) or 3/(1+3) or 3/4 or 75%, and is 0.75 of 36 total or a count of 27.
 The missing information is obtained by replacing the values for marks, 1 and 0, for right and wrong, in a mark data matrix, as in PUP Table 3, with the probability of students making a right mark, that ranges from 0 to 1.
Winsteps fits mark data to the Rasch model, using probabilities, to produce estimated student ability and item difficulty measures on the same horizontal logit scale. It is from these estimated measures that the Rasch model creates (maps) predicted raw scores used as cut scores.


No comments:
Post a Comment