42
Do equivalent individual latent student ability and item
difficulty calibration locations really match? They do at the zero logit or 50%
normal location. A successful convergence places the two distribution means at
this same location.
 The Cantrell logit PUP PROX data (see prior post) show the student ability
and item difficulty locations successfully centered on or near the zero logit
location. The average test score is 48%. Also the locations are successfully
plotted in perfectly straight lines on the logit scale. However, the ability and difficulty distributions do not have the same rates of expansion and they are not parallel.
The Cantrell logit PUP PROX data (see prior post) show the student ability
and item difficulty locations successfully centered on or near the zero logit
location. The average test score is 48%. Also the locations are successfully
plotted in perfectly straight lines on the logit scale. However, the ability and difficulty distributions do not have the same rates of expansion and they are not parallel.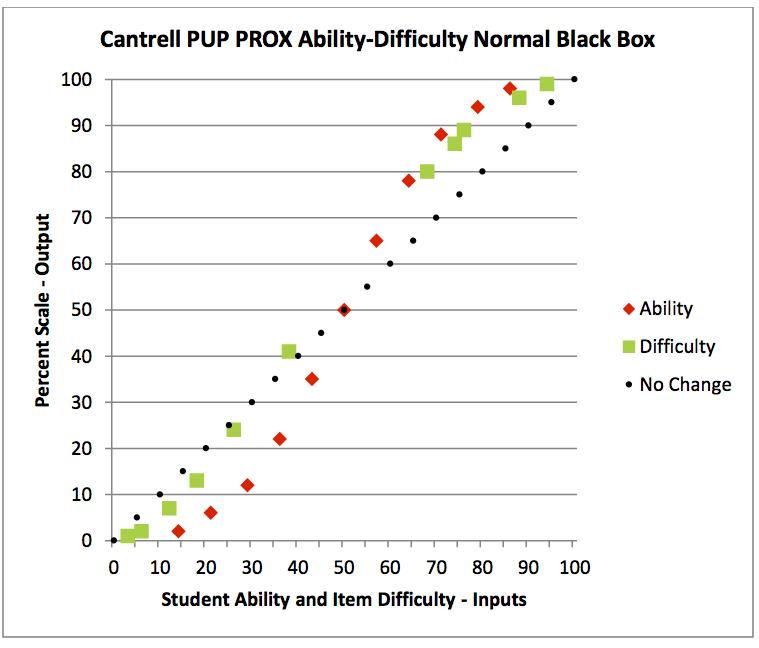
The Cantrell normal PUP PROX conversion from the logit scale throws the student ability distribution into an S-shaped curve. It is still centered at the 50% point.
When the latent student ability locations are being expanded
on the logit scale during convergence, they are moving at logit speed (2.718
times faster than normal speed). The farther they are away from zero, the
faster they move. The result is a grouping of locations in the outer arms of
the normal distribution.


 The Cantrell Winsteps data show even greater dispersion
after ten JMLE iterations past the PUP PROX data. The zero location is not
maintained, and S-shaped curves have now developed in both ability and difficulty distributions. These
become even more exaggerated when converted to normal values.
The Cantrell Winsteps data show even greater dispersion
after ten JMLE iterations past the PUP PROX data. The zero location is not
maintained, and S-shaped curves have now developed in both ability and difficulty distributions. These
become even more exaggerated when converted to normal values.  This development of an S-shaped curve results from expanding
student ability locations. A chart based on the Rasch model curve shows the
effect of expansion from one (no change) to four times. PUP PROX yielded an
expansion factor of 2.15 and Winsteps yielded an estimated 3.09. Convergence
operations are carried out on a linear logit scale. When converted, the normal
student ability results are thrown into an S-shaped curve where the locations
clump at the ends of the distribution.
This development of an S-shaped curve results from expanding
student ability locations. A chart based on the Rasch model curve shows the
effect of expansion from one (no change) to four times. PUP PROX yielded an
expansion factor of 2.15 and Winsteps yielded an estimated 3.09. Convergence
operations are carried out on a linear logit scale. When converted, the normal
student ability results are thrown into an S-shaped curve where the locations
clump at the ends of the distribution.  The Nursing1 logit, PUP PROX and Winsteps (PROX & JMLE),
results show very different results from Cantrell results. The average test
score is 80% rather than 48% (mastery rather than meaningless ranking). Student
ability locations are successfully centered on the zero location. Both ability and difficulty distributions are plotted in perfectly straight lines. A difference in average
raw score between the two data sets, of 32%, has moved the item difficulty
location distribution far away from the zero location. The initial shift of the
average input Nursing1 item difficulty logit location was 1.62 logits.
The Nursing1 logit, PUP PROX and Winsteps (PROX & JMLE),
results show very different results from Cantrell results. The average test
score is 80% rather than 48% (mastery rather than meaningless ranking). Student
ability locations are successfully centered on the zero location. Both ability and difficulty distributions are plotted in perfectly straight lines. A difference in average
raw score between the two data sets, of 32%, has moved the item difficulty
location distribution far away from the zero location. The initial shift of the
average input Nursing1 item difficulty logit location was 1.62 logits. The Nursing1 normal PUP PROX conversion from the logit scale
results in a large curve for item difficulty locations and a shallow S-shaped
curve for student ability locations. The full nature of the curves was exposed
by extending the data.
The Nursing1 normal PUP PROX conversion from the logit scale
results in a large curve for item difficulty locations and a shallow S-shaped
curve for student ability locations. The full nature of the curves was exposed
by extending the data. A linear shift of zero (no change) and 0.5, 1.0, and 1.5
logits of item difficulty locations shows how the curve in the Nursing1 data
developed -- the greater the shift, the lower the curve. Item difficulty
locations did not migrate toward the ends of their distribution as do student
ability locations.
A linear shift of zero (no change) and 0.5, 1.0, and 1.5
logits of item difficulty locations shows how the curve in the Nursing1 data
developed -- the greater the shift, the lower the curve. Item difficulty
locations did not migrate toward the ends of their distribution as do student
ability locations.
Both PUP non-iterative PROX and Winsteps, iterative PROX and
JMLE, produce the desired results when fed good test score data. I can now
understand the reason for the many features included in Winsteps to help
skilled operators to detect and cull data that does not meet the requirements
of the perfect Rasch model.
The Cantrell data do not fit the requirements. This may
be part of the reason Cantrell failed to find student ability and item difficulty
independence.
Good data must then have similar distributions (standard
deviations). The average test score does not need be near 50% for a good
convergence.
I am calling the Nursing1 data a good fit for dichotomous
Rasch model analysis based on three
observations: 1. Both PUP PROX and Winsteps obtained the same analysis results
(non-iterative PROX and iterative PROX:JMLE). 2. The relative location of
student ability and item difficulty remained stable from input to output. 3.
The logit plot is a perfectly straight line for both student ability and item
difficulty locations (considering rounding errors).
No comments:
Post a Comment