Wednesday, September 26, 2012

Rasch Model Convergence Normal Black Box


                                                             46
The normal black box displays IRT results on a normal scale that can be compared directly to CTT values. The four charts from Fall8850a.txt, rating scale, culled rating scale, partial credit, and culled partial credit at not too different from the logit black box charts in the prior post. The un-culled data set included 50 students and 47 items. The culled data set included 43 students and 40 items (7 less outlying students and items each).


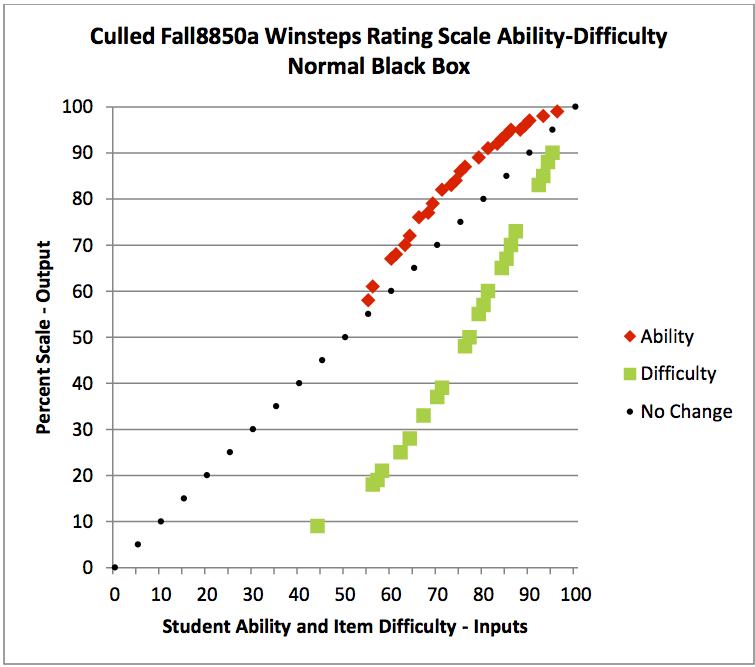
The first three charts show student abilities passing through the 50%, zero logit, point. Failure for this to be the case with culled partial credit was observed in the prior logit black box post, but is very evident in this normal scale chart. The culled partial credit analysis passed through three iterations of PROX rather than two for the other three analyses.


A curious thing was discovered when developing the extended normal values for student abilities. Up to now all extended student ability estimates only involved multiplying the log ratio value of student raw scores by an expansion factor. For the culled partial credit analysis, a shift value had to be included, as is normally done when estimating item difficulty values. A shift value was not needed when estimating student ability values with the un-culled partial credit data set, or any other data set I have examined. The plot of the extended student abilities would not drift away from the no change line without the additional shift of 0.4 logits.

Student scores are used as a standard in non-transposed analyses. The un-culled data set, using partial credit analysis, will now be used in a transposed analysis where item difficulties become the standard for the analysis. This may clarify the relationship between the quality and quantity scores from Knowledge and Judgment Scoring for each student and the single latent student ability value from Rasch IRT.


Wednesday, September 19, 2012

Rasch Model Convergence Logit Black Box


                                                             45
This view of Fall8850a.txt Winsteps results has been visited before. The difference is that now I have an idea of what the charts are showing in three ways:


1. The plot of student abilities for the rating scale analysis passes directly through the zero logit location indicating a good convergence. 2. The plots for student abilities and item difficulties are perfectly straight lines (considering my rounding errors), which again shows a good convergence. 3. The two lines are parallel, another indicator of a good convergence.

Culling increased the distribution spread to higher values for both analyses, as shown in the previous post. The plot of student abilities for culled partial credit did not pass through the zero logit location. Removing 7 students and 7 items has resulted in a poor convergence.

The item difficulty plots for the partial credit analysis are very different from those from the rating scale analysis. Here items starting convergence with the same difficulty can end up at various ending locations. The lowest and the highest locations are plotted for each item.

This post must end, as a comparison of Rasch IRT and PUP CTT results cannot be made directly between logit and normal scale values. 

Wednesday, September 12, 2012

Rasch Model Logit Locations


                                                              44
Student ability and item difficulty logit locations remain relatively stable during convergence when using data that are a good fit to the requirements of the perfect Rasch IRT model. The data in the Fall8850a.txt file requires that the average logit item difficulty value be moved one logit, from -.98 to 0, during convergence. The standard deviations for student ability and item difficulty, 0.51 and 1.0, are also quit different.

The relative location of individual student abilities and Item difficulties vary, from the two factors above and from the culling of data that “do not look right”, during the process of convergence on the logit scale. Individual changes in the relative location of student ability and item difficulty can be viewed by re-plotting the bubble chart data shown in the previous post.


The rating scale analysis groups all students with the same score and all items with the same difficulty. The end result is a set of nearly parallel lines connecting the starting and ending convergence location of a student or an item. (Closely spaced locations have been omitted for clarity.)

Culling outliers resulted in the loss of values among the less able students and the more difficult items.

This increased the student ability mean and decreased the item difficulty mean. Culling increased the spread of both distributions toward higher values.


The partial credit analysis groups all students with the same score but treats item difficulty individually. (More locations have been omitted for clarity.) Four of the plotted starting item difficulty locations land at more than one ending convergence location. Culling partial credit outliers had the same effects as culling rating scale outliers (above) related to where the culling occurred, the migration of means, and the direction of distribution spread. (More item difficulty locations were omitted for clarity.)

The item difficulty mean migrated to the zero logit, 50% normal, location in all four analyses: full rating scale, culled rating scale, full partial credit, and culled partial credit. Winsteps performed as advertised for psychometricians .

The individual relative locations for student ability and item difficulty differ in all four analyses. Two items, that survived my culling and omitting, have the same starting location but very different ending locations: Item 13 and Item 41. Both are well within the -2 to +2 logit location on the Winsteps bubble charts (item response theory – IRT data).

PUP lists them as the two most difficult items on the test (classical test theory – CTT data). PUP lists Item 13 as unfinished, with 15 out of 50 students marking, of whom only 5 marked correctly. There is a serious problem here in instruction, learning, and/or the item itself. Item 41 was ranked as negatively discriminating (four of the more able students in the class marked incorrectly). Only 5 students marked item 41 and none were correct. The class was well aware that it did not know how to deal with this item. Both items were labeled as guessing.

IRT and CTT present two different views of student and item performance. The classroom friendly CTT charts produced by PUP require no interpretation for students and teachers to use directly in class and when advising.

Wednesday, September 5, 2012

Culling Rasch Model Data


                                                             43
The past posts have been concerned with how IRT analysis works when using different ways to estimate latent student ability locations and item difficulty locations. So far it seems that with good data a student ability location and an item difficulty location, at the same point on the logit scale, do represent comparable values. They will never make a perfect fit as that can only happen if the student ability and item difficulty distributions have means of 50% or zero logits and they have the same standard deviation or spread.

The perfect Rasch IRT model can never be completely satisfied. Winsteps, therefore, contains several features to remove data that “do not look right”. For this post, students and items more than two logits away from the bubble chart means were removed (that is more than about two standard deviations). The Fall8850a.txt file with 50 students and 47 items (no extreme values) was culled by 7 students and 7 items to 43 students and 40 items.

In both cases, rating scale and partial credit, culling resulted in lowering the standard error of locations (smaller bubbles). This improved the analysis. In both cases it also increased the estimated latent student ability and item difficulty locations. Getting rid of outliers, made the overall performance on the test look better.