Saturday, November 27, 2010

Guttman Scalogram


Next   Back   Start                     Chapter 5

The information in Ministep Table 22.1 Guttman Scalogram of Responses has been re-plotted, to the right, into a perfect Guttman pattern. A string of right marks is followed by a string of wrong marks. In this perfect pattern, when a student misses a question on the test, all questions that are more difficult are also missed. The easiest question the student misses sets the student's ability. 


[Winsteps Table 22.2 Guttman Scalogram of Zoned Responses adds more information to PUP Table 3. 
Observations more than 0.5 rating points away from their expected category are marked with a letter equivalent: @ = 0, in expected category, and A = 1, just outside of expected category. 


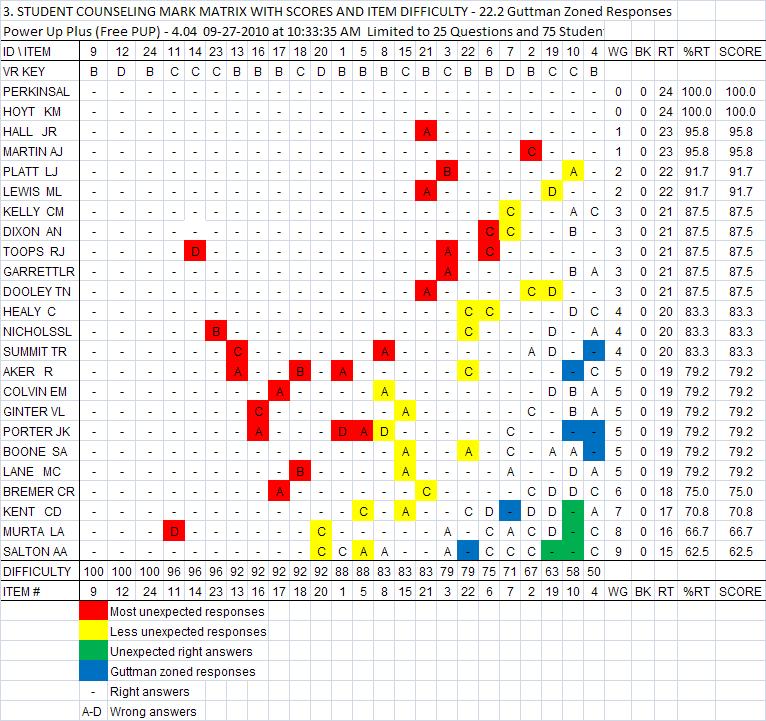
The observations that are outside of their expected category are plotted in blue in this not so perfect world. Each blue mark shows a right answer assumed to be too difficult for that student. Green is both an unexpected and a too difficult right response. Only Item 20 shows a perfect performance pattern.

Otherwise there is a mix of right and wrong marks at the boundary of a student knowing and not knowing, and of a question being marked right or wrong, on PUP Table 3. Table 22.3 Guttman Scalogram of Original Responses is identical, in content, to PUP Table 3. PUP Table 3 is a Guttman Scalogram. 

Next     Back    Start

Thursday, November 25, 2010

Item Discrimination


Next   Back   Start          Chapter 4

PUP Table 3 is re-tabled using three levels of item discrimination as PUP Table 3a. Mastery/Easy items survey student knowledge and provide a positive adjustment to the test score. Discriminating items divide the class into groups of students who know and who do not know. A change in instruction or special attention may be needed. Unfinished items reflect a problem in instruction, learning and/or testing.

Three easy items show how item discrimination works. Item 14 shows negative discrimination (ND) as only one high scoring student missed it. Item 11 shows positive discrimination (B) as only one low scoring student missed it. Item 20 shows the maximum positive value (A) as only the bottom two students missed it. This is an example of perfect item performance, a  Guttman pattern: a string of all correct marks followed by all wrong marks.

Although discrimination is not a part (a parameter) of the Rasch model, it is such an important descriptive statistic in managing the Rasch model that it is printed, in several forms, in both the person and the item statistics. Ministep therefore prints discrimination values rather then levels (A, B, C, and D) as printed by PUP. PUP and Winsteps calculate the same corrected point biserial r (pbr) when the “PTBISERIAL = Yes” control variable is used. PUP only prints the descriptive item or question pbr statistic.

These differences reflect the different optimization in the software. Winsteps maximizes the production of stable efficient tests. PUP optimizes easy to use data for instruction, testing and student counseling.

Items that tend to fit the Rasch model best also tend to be discriminating. Items 5, 6, 7, and 8, with a range of difficulty from 71% to 88% (average difficulty = 84%), will be used as common items to link two tests.

Next    Back   Start

Thursday, November 18, 2010

All Most Unexpected Responses

Next   Back   Start          Chapter 3

Ministep prints out two identical Tables, 6.6 and 10.6, showing additional, less unexpected, responses to those in Table 6.5, persons, and Table 10.5, items. These less most unexpected wrong responses have been added in yellow to PUP Table 3 Student Counseling Mark Matrix with Scores and Item Difficulties.
Also four unexpected right answers are added in green. They raise the question, “How did these low scoring students manage to make right marks on these two difficult items?”  Was it luck, guessing, copying or an accurate report of knowledge? This question cannot be answered with the combined evidence from Winsteps posted on PUP Table 3.

Student marks that fit the Rasch model the best reside along a line separating yellow and uncolored wrong marks.  Red and green marks contribute the most to unfitness in the model. This makes good sense.

High scoring students are assumed to be careless in making wrong marks (red). Less able students are expected to be careless too (yellow). Low scoring students are suspect when making right marks on difficult questions (green). These are basic expectations of IRT.

PUP includes a guessing monitor (a quality score for judgment, only with Knowledge and Judgment ScoringTM) and a copy detector (Sheets 8 and 9).

Next   Back   Start

Thursday, November 4, 2010

Winsteps Item Most Unexpected Responses

Next   Back   Start                Chapter 2

A companion table to person most unexpected responses (Table 6.5) drawn from Winsteps Table 17.1 Person Statistics is the table of item most unexpected responses drawn from Table 13.1 Item Statistics.

The data from three columns in Table 13.1 are re-tabled into Winsteps Table 10.5 Most Unexpected Responses.

 These values are plotted, in red, on PUP Table 3. 


Item 11, with an estimated IRT difficulty measure of -1.51, is the easiest question any student missed, by Murta. Item 2, with an estimated IRT difficulty measure of 1.14, is the most difficult question with an unexpected response, by Martin. This rank of unexpected responses is again directly related to item difficulty on PUP Table 3. This makes good sense.

Difficult questions are expected to receive wrong marks. No wrong marks are expected on easy questions. High ability students are expected to mark difficult items correctly. These are basic expectations for IRT.

Of interest here is that the locations of the most unexpected responses for person and for item are identical on PUP Table 3. The person scan of PUP Table 3 is from highest score to lowest score, vertically, and the item scan of the table is from easiest to most difficult, horizontally.

These most unexpected responses are calculated on average and in general, as is characteristic of right mark scoring (RMS). The test instructions are to mark the best answer on every question. Students are not given the responsibility, and a reward, for reporting, on each specific question, what they know and do not know, as is done with Knowledge and Judgment ScoringTM (KJS).

Next   Back   Start


Tuesday, November 2, 2010

Winsteps Person Most Unexpected Responses


Next  Back  Start            Chapter 1

The Rasch model IRT test score analysis has become a “commonly used statistical procedure” wrapped in layers of mystery. By contrast, right mark (or count) scoring (RMS) analysis is traditionally evaluated by just looking directly at a table of marks bounded by student test scores and question difficulty values.

One way to audit the Rasch model is to compare IRT and RMS analysis printouts. Many show identical data. Other IRT printouts provide valuable insights not present in RMS analysis.


A test of 24 students by 24 questions  was scored with Ministep and with Power Up Plus (PUP). Passing was 75% on this nursing school test.

Winsteps prints out identical data in Table 17.1 Person Statistics. Student names  are even listed in the same order for students with the same score.


The data from four columns in Winsteps Table 17.1 are re-tabled into Winsteps Table 6.5 Most Unexpected Responses.


 These values are plotted in red on PUP Table 3.


Hall, with an estimated IRT ability measure of 3.44 is the highest scoring student to have missed a question, #21. Murta, with an estimated IRT ability measure of 0.58, is the next to the lowest scoring student, missing #11, and seven more. This ranking of unexpected responses is directly related to student test scores. This makes good sense.

Top students are not expected to make wrong marks. No student is expected to miss easy questions. These are basic expectations for IRT.

Next  Back  Start